Introduction to StepMaster
Introduction to StepMaster
Data Sets Suitable for StepMaster
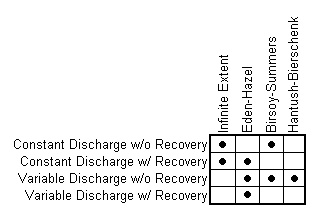
StepMaster can be used to analyze a variety of tests including constant discharge, variable discharge step test, and recovery tests. The following table shows which methods are suitable for each data set.

Information Obtained with a StepMaster Analysis
When fully implemented and with proper data, StepMaster can help estimate:
![]() aquifer transmissivity
aquifer transmissivity
![]() aquifer storativity
aquifer storativity
![]() linear and non-linear well losses
linear and non-linear well losses
![]() well efficiency
well efficiency
![]() drawdown of the well at a pumping rate and time other than that tested
drawdown of the well at a pumping rate and time other than that tested
How do I enter data?
Data is entered by the keyboard from selections on the Edit menu. Information such as title , site name and location are entered from Edit | Site Information. Step pumping rates and times, aquifer dimensions and well radius dimensions are entered from Edit | Aquifer Parameters. Time and drawdown values are entered from Edit | Time and Drawdown. Before entering data, desired units are selected from Options | Units.
StepMaster also imports digital data logger files in most formats without editing, as well as files in Geraghty & Miller's AQTESOLV format. Select File | Import to import data logger files or AQTESOLV file
Analyzing Data
Three step drawdown test analysis methods are included in StepMaster 2.0. These are the Hantush-Bierschenk method, the Eden-Hazel method, and the Birsoy-Summers method.
For the Eden-Hazel method and the Hantush-Bierschenk method, best fit lines on the first set of graphs are used to obtain values for the second set of graphs. The user controls which points are included in the best fit line process by using the up and down arrow keys, or using the More Trials or Less Trials buttons on the Control Panel. The user controls which step is analyzed by using the left and right arrow keys or the Next Step or Previous Step buttons on the control panel.
An entire step of data can be omitted from the analysis by making that step the current step and pressing F12 or pressing the Exclude Step button on the control panel. Pressing F12 again or pressing the Exclude Step button on the Control Panel will reinstate that step to the calculations.
Data excluded from the analysis can be displayed in a different color or with a different symbol than data included in the analysis.
Tables of data can also be created for the Eden-Hazel method and the Birsoy-Summers method. Although these tables do not include an analysis of the data, they do include values important to the calculations for each method. The tables are tab-delimited to be imported into a spreadsheet. These table can be used to help verify the results of the tests, or perform additional analysis for each method.
The View Menu
The View menu controls what is displayed in the StepMaster window. Simple data graphs can be displayed, or the numerical data from the test. Analysis methods that display graphs on the screen are also chosen from the View menu.
Displaying Results
Results of the calculations are displayed on the graphs. The graphs can be customized using features from the Options menu. The graph can be printed from File | Print. The printed appearance of the graph can be customized with File | Page Setup.