Birsoy-Summers Method
Birsoy-Summers (1980) Method
See Also:
As implemented in StepMaster, the Birsoy-Summers test has the following properties:
- Aquifer transmissivity and storativity can both be estimated. Well loss coefficients are not estimated.
- Pumping rate may increase or decrease to the next consecutive interval of the test.
- Data can be collected from a pumping well or an observation well. The distance to the observation well is required to estimate storativity.
- The Birsoy-Summers solution is based on the Jacob approximation to the Theis equation, and therefore is applicable for confined aquifers.
- The method can be used for constant discharge tests.
- As implemented in StepMaster, the method is not suitable for recovery tests.
Procedure:
After the data is entered, select Birsoy-Summers from the View menu. A graph will appear on the screen. Specific Drawdown (s/Q in days/square meter) is graphed arithmetically on the vertical axis. Adjusted Time in days is graphed logarithmically on the horizontal axis.
The slope of the line is used to determine transmissivity. The value of Adjusted Time when specific drawdown is zero, is used to calculate storativity.
Mathematical Development:
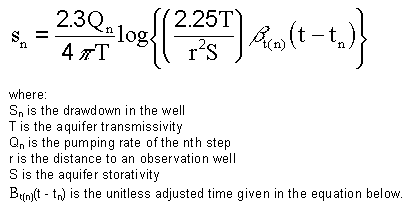
According to Kruseman and de Ridder (1990), Birsoy and Summers (1980) applied the principal of superposition to Jacobs approximation of the Theis equation to obtain the following expression for drawdown in the aquifer at time t during the nth period of intermittent pumping.
Equation 1

Equation 2

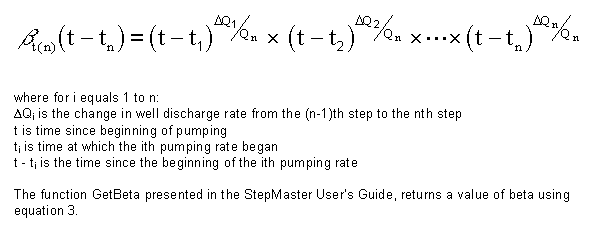
which can also be written as:
Equation 3

For a pump test with m steps, beta is determined for each time measurement for each step n as n increases from 1 to m.
The Graphical Solution
Dividing Equation 1 by Qn gives an expression for specific drawdown in Equation 4.
Equation 4

Specific drawdown is plotted arithmetically against adjusted time plotted logarithmically. A best fit line is drawn through the points. Transmissivity is determined from the slope of the line and Equation 5.
Equation 5

The intersection of the line with the adjusted time axis where specific drawdown is zero is used to calculate transmissivity with Equation 6.
Equation 6

Final Notes:
Kruseman and de Ridder (1990) add the condition for use of the method that:

It is should also be noted that when used for constant discharge tests (i.e. tests with only one step) Beta is equal to the time since pumping began, and the entire procedure simplifies to become identical to the Cooper-Jacob straight-line method.