Eden-Hazel Method
Eden-Hazel (1973) Method
See Also:
Predicting Drawdown at Different Rates
The Eden-Hazel method is useful to estimate the aquifer transmissivity and the non-linear well loss coefficient C. From these values, drawdown in the well at any time and pumping rate can be determined while accounting for non-linear well losses. As implemented by StepMaster, the method can be used for constant discharge tests with recovery data, step-wise increasing and decreasing pumping rate tests with or without recovery data.
StepMaster uses a two part graphical technique to solve step-drawdown tests using the Eden-Hazel method. Before using the method, make sure that all of the necessary data has been entered.
A value referred to as Hn in the literature is used in the first graph. Selecting Tables | Eden-Hazel Table will create a table including the Hn values for a test.
Mathematical Development:
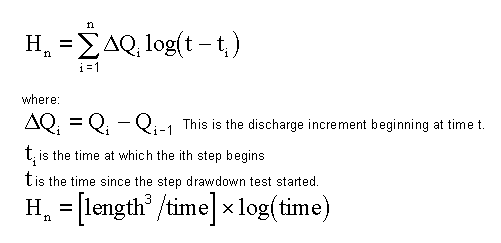
Hn is given by the equation (Eden and Hazel, 1973):
Equation 1:

For a test with m different pumping rates, H is calculated for n = 1 to n = m. As n loops from 1 to m, I loops from 1 to n for each n.
Observed drawdown is plotted arithmetically against Hn with Hn on the horizontal axis. A best fit line is drawn through each step such that the slope of each line is the same. The intersection of the vertical axis and each best fit line gives the value of A in units of length.
Equation 2:

In the second portion of the Eden-Hazel method, a graph of A/Q is plotted against Q. The slope of the line is used to determine C.
Part 1
Select View | Eden-Hazel Part 1. A graph of Hn verses drawdown will appear. A series of best fit lines is drawn through the points of each step such that each line has the same slope. The intercept of these lines with the y-axis is the A value for each step.
The slope of the lines is the value of b which is used to calculate transmissivity with the equation:
Equation 3:

Transmissivity will be displayed over the graph in units selected from Options | Unit.
Part 2
Select View | Eden-Hazel Part 2. In part 2, a graph of arithmetic An/Qn on the vertical axis and arithmetic Qn on the horizontal axis is used to obtain the parameters a and C. A best fit line is drawn through the points. The slope of the line is equal to C. The intercept of the line with the vertical axis is equal to a.
Using the slope of the lines from part 1 (b) and the slope and intercept of the lines from part 2 (a and C respectively) an equation for the drawdown in the well at any time t and any pumping rate Q is obtained.
Equation 4:
![]()
If a step has been excluded from the analysis, the data will not be included in the best fit line, and the data point will be displayed in the color selected for excluded data.