Hvorslev Graphical Method
Hvorslev Graphical Analysis
(full or partial penetration)
View | Hvorslev Graph
See Also:
Excluding Data Points from Analysis
Aquifer Scenarios:
Hvorslev Case A (partial penetration)
Hvorslev Case B (partial penetration)
Hvorslev Case C (full penetration)
The Hvorslev graphical analysis draws a best fit straight line through the plot of log head ratio vs. time. The slope of this line is used to determine hydraulic conductivity. Calculation results are displayed on the screen.
Weighting the First Point
The Hvorslev method is commonly implemented with one of two assumptions. The first is that the best fit line should be drawn with all points weighted equally. The second is that the line is always drawn through Ho = 1.0, and is best fit to the remaining points.
Super Slug allows both of these weighting options. The choice is controlled from Options | Graph Options. If Weight Line Fit to First Point is checked, the best fit line will be drawn through Ho = 1.0. If this box is not checked, the line will be drawn with all points weighted equally. This option can be changed while viewing the graph so the effect on the calculations can be easily determined.
Note: If a small number of data points is included in the best fit analysis, the line may not pass exactly through the first point. even if Weight Line Fit to First Point is checked. This is because the first point is statistically weighted in the analysis, but it is not precisely fixed.
Controlling Data Set Size:
It is not necessary to include the entire data set in the best fit analysis. In many tests, the data logger is allowed to run past the time where useful data is collected. Including very late time data in you calculations will bias your results toward the end of the slug test.
The size of the data set can be controlled with the on-screen buttons ![]() , or the arrow keys.
, or the arrow keys.
Weighted to First Point -- If the best fit line is weighted to the first point, data points can only be included or excluded from analysis at the end of the slug test. The graph can be displayed showing points not included in the analysis, or only showing points included in the analysis. This option is controlled from Options | Graph Options.
Not Weighted to First Point -- If the best fit line is not weighted to the first point, data points can be included or excluded from the best fit line analysis at both the beginning or the end of the test.
Excluding Data Points
Data points can be included or excluded with the on-screen buttons or with the keyboard.
For the end of the test:
Data adjustments for the end of the test are controlled by the arrow buttons in the lower right corner of the screen.
The up arrow key and right arrow button increase the number of points to which the line is fit.
The down arrow key and left arrow button decrease the number of points to which the line is fit.
For the beginning of the test
Data adjustments for the beginning of the test are controlled by the arrow buttons in the lower left corner of the screen.
Use shift-up arrow key or the left arrow to increase the number of points to which the line is fit.
Use shift-down arrow key or the right arrow to decrease the number of points to which the line is fit.
For example, if the test originally had 150 data points, pressing the down arrow once would cause the line to be fit to the first 149 points. Pressing the up arrow would increase the size by one. The line would then be fit to the first 150 points. The graph will indicate the number of points included in the analysis, and the beginning and end point of the best fit analysis.
Mathematical Development:
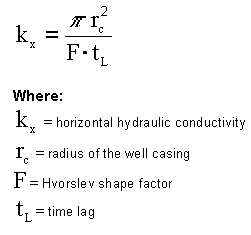
Time lag is the time at which the Head Ratio = 0.37 (the point at which the natural logarithm of the head ratio = -1.0). When the best fit line is drawn, a dashed line will indicate time lag. After the determination of time lag, hydraulic conductivity is calculated with the equation below:

In some graphical situations, time lag will be negative. This results in a negative value of hydraulic conductivity, which is obviously incorrect. In this case, data adjustments are probably necessary at the beginning of the test, or the line should be weighted to the first point.