Hvorslev Auto-Solve Method
Hvorslev Automatic Parameter Estimation
(full or partial penetration)
See Also:
Excluding Points from Analysis
Aquifer Scenarios:
Hvorslev Case A (partial penetration)
Hvorslev Case B (partial penetration)
Hvorslev Case C (full penetration)
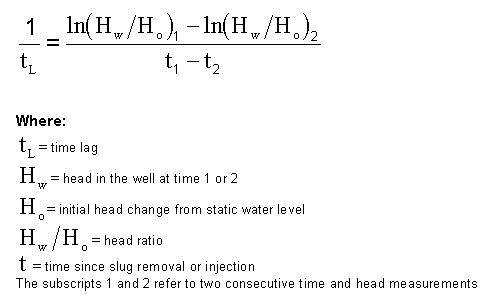
Time lag is the time at which the Head Ratio = 0.37 (the point at which the natural logarithm of the head ratio = -1.0). A value of the time lag is calculated using Equation 1 below.
Equation 1:

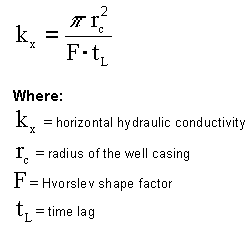
The Hvorslev automatic parameter estimation method in Super Slug calculates a value for time lag for each consecutive pair of time and drawdown values. With Equation 2 below, Super Slug then calculates hydraulic conductivity for each value of time lag.
Equation 2:

This results in a maximum of n-1 values of hydraulic conductivity for n drawdown measurements. Geometric mean and arithmetic mean of the hydraulic conductivity is then calculated.
Unsolvable Values:
Note that Equation 1 fails for situations where the consecutive drawdown values are the same. The right-hand side of the equation goes to zero, making time lag infinitely large. Using Options | Eliminate Duplicates will reduce this occurrence.
For a test with n time/drawdown pairs, there will ideally be n-1 values of hydraulic conductivity. Slug test data recorded with an electronic data logger will frequently have two or more consecutive identical drawdown values. Some tests will even have slight increases in data. In these cases, Super Slug does not calculate a value of hydraulic conductivity. A "---" is displayed in the output file.
When the mean values of hydraulic conductivity are determined, these unsolvable values are not included in the determination of the mean. For example, if a test has 50 time/drawdown measurements, but only 40 values of hydraulic conductivity can be calculated by the data, the average hydraulic conductivity will be determined from the 40 calculated values.
Excluding Unwanted Data
Unwanted data from the beginning and the end of the test can be excluded from the analysis. Select one of the graphical analysis methods and exclude any undesired data. Then run the automatic test.