Displaying Calculations in Text Boxes
Text Boxes
Displaying Calculation Results
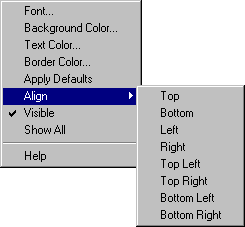
For graphical and type curve methods, calculation results are displayed in customizable text boxes. Text box properties are set from the text box speed menu shown below. This is accessed by clicking the right mouse button over the text box.

Setting Default Values
Default values can be set for text boxes. All newly created text boxes will be displayed with default values. Default font is selected from Options | Graph Fonts | Calculations. Text color, border color, and background color are set from Options | Graph Colors.
Customizing Text Boxes
Text box features are selected from a speed menu. To access the speed menu, right-click the mouse button inside the text box. Options are available to set font, text color, background color, and border color. Select Apply Defaults from the speed-menu to reset all text boxes to default values. Default box appearance is saved with the Super Slug data file.
Moving Text Boxes
Text boxes can be moved by holding down the left mouse button over the text box and dragging it to a new location. Then release the mouse button. Placement of the text box is saved with the Super Slug data file. Text boxes can also be aligned to a portion of the graph by selecting an alignment options from the Align sub-menu on the text box speed menu.
Saving Text Boxes
Text box properties and location are saved with Super Slug data files. When the file is reloaded, the text box properties and locations will be restored.
Printing With Text Boxes
The text box is automatically sized for the font of the text. When text boxes are printed, Windows may select a different font size when drawing the display to the printer. This may slightly alter the position of the box with respect to other graph features.
Text Box Visibility
Text boxes can be hidden or made visible by selecting Visible from the text box speed menu. Select Show All to make all text boxes visible.