Bouwer and Rice Graphical Method
Bouwer and Rice Graphical Method
(Full or Partial Penetration)
See Also:
Excluding Points from Analysis
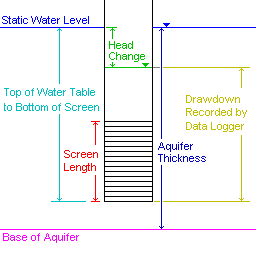
The Bouwer and Rice method applies to the aquifer scenario shown in the figure.

The aquifer can be either fully penetrated or partially penetrated by the screened portion of the well. The Bouwer and Rice method is designed for unconfined aquifer scenario's, however use in confined or leaky aquifer scenario's can give reasonable estimates of hydraulic conductivity.
Value Substitutions:
In some aquifer scenario's, the Bouwer and Rice formula will result in taking the logarithm of a negative number. The following value substitutions will be made to prevent this occurrence.
- If the distance from the top of the water table to the bottom of the well screen is greater that the aquifer saturated thickness (screen penetrates below the base of the aquifer), the aquifer saturated thickness is used for the distance from the top of the water table to the bottom of the well screen.
- If the screen length is greater that the distance from the top of the water table to the bottom of the well screen (screen sticks above the water table), then the top of the water table to the bottom of the well screen is used for the screen length.
- If the screen length is greater than the aquifer saturated thickness, the aquifer saturated thickness is used for the value of screen length.
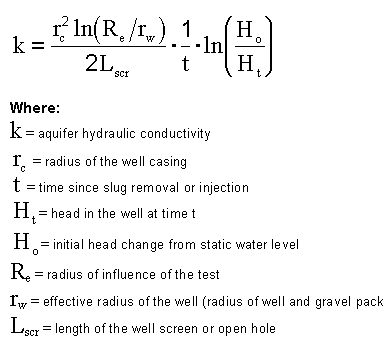
Hydraulic conductivity is determined with the equation:
Equation 1

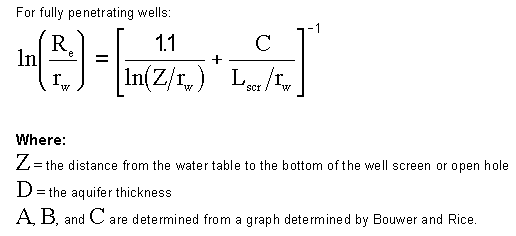
ln(Re/rw ) is determined with one of the equations below:
Equation 2

Equation 3

Determining Partial or Full Penetration
Equation 2 is used for partially penetrating wells, and Equation 3 is used for wells that fully penetrate the aquifer.
Super Slug automatically determines if the well is fully or partially penetrating and selects the proper parameters. If the well is greater than 95% fully penetrating, Super Slug will assume full penetration and use Equation 3.
The Graphical Method
Super Slug plots a graph of the log of head ratio (Ht/Ho) on the vertical axis, and the time on the horizontal axis. A straight line is fit through the data points. The slope and the intercept of the line are used to calculate the time for a head ratio of 0.01. The calculated time, the head ratio 0.01, and the other variables described above are used in Equation 1 to determine hydraulic conductivity.
Note that equation 1 uses a head ratio calculated as Ho/Ht. All other methods and graphs (including the Bouwer and Rice graph) use a head ratio calculated as Ht/Ho.
When the graphical method is selected, two pairs of arrow buttons will appear at the bottom of the screen. These buttons are used to control which data points are included in the best fit analysis.
Excluding Data Points
For the end of the test:
Data adjustments for the end of the test are controlled by the arrow buttons in the lower right corner of the screen.
The up arrow key and right arrow button increase the number of points to which the line is fit.
The down arrow key and left arrow button decrease the number of points to which the line is fit.
For the beginning of the test
Data adjustments for the beginning of the test are controlled by the arrow buttons in the lower left corner of the screen.
Use shift-up arrow key or the left arrow to increase the number of points to which the line is fit.
Use shift-down arrow key or the right arrow to decrease the number of points to which the line is fit.